
Des Moines, Iowa Municipal Fleet Leasing

The City of Des Moines, Iowa discovers cost-effective procurement strategy to begin transitioning EVs into their municipal fleet
- The City of Des Moines was able to procure 4 Nissan Leaf EVs using a municipal lease program
- By evolving procurement to include municipal leasing options, EV business cases can become more cost justified, reducing initial upfront capital costs and realizing operational savings immediately
- Activity conducted since 2019
Case Study Information
Overview
Company: The City of Des Moines, IowaType: Municipal fleet
Location: Des Moines, Iowa
Case Study Publishing Date: November 2020
Program Goals: Explore fleet leasing as a viable alternative to vehicle purchasing
Replacement Vehicle Class: Class 1 passenger vehicle
Vehicle Use Case: Short-distance travel by city employees in the Community Development Department
Replacement Vehicle Fuel Consumption: N/A
Case Study
Objective:The City of Des Moines, Iowa engaged with the The Climate Mayors Electric Vehicle PurchasingCollaborative to identify suitable vehicles for EV replacement and explore cost-effective procurement strategies via a municipal leasing program
VEHICLE OVERVIEW
Number of Vehicles: 4
Types of EVs: Nissan Leaf
EV Deployment Timeline: 2020
CHARGING OVERVIEW
Charging Infrastructure: N/A
Charging Infrastructure Costs: N/A
OPERATIONS & MAINTENANCE
Capital Costs: $23,899 per vehicle, less federal incentives and credits
Operations & Maintenance: N/A
TRAINING & CHANGE MANAGEMENT
Training: N/A
Change Management: N/A
Summary
Lessons Learned:Next Steps:
References
Case Study SourceThe Climate Mayors Electric Vehicle Purchasing Collaborative (the Collaborative). Saving Money with Electric Vehicle Leasing November 2020. https://driveevfleets.org/wp-content/uploads/2018/09/Leasing-Case-Study-Final-11.24.2020.pdf
About the Climate Mayors Electric Vehicle Purchasing Collaborative
The Climate Mayors Electric Vehicle Purchasing Collaborative (the Collaborative) is a joint effort by Climate Mayors, the Electrification Coalition, and Sourcewell working toward accelerating the transition of city fleets to electric vehicles (EVs). By creating a new and innovative cooperative purchasing mechanism, the Collaborative is reducing major barriers to fleet electrification for cities and other public agencies. In addition to an innovative cooperative purchasing option, the Collaborative offers a host of technical resources, analyses, and staff support, which reduces major obstacles to fleet electrification.
About Climate Mayors
Representing over 74 million Americans from 48 states, Climate Mayors is a diverse network of 466 U.S. city mayors who have committed to fighting climate change. Originally founded in 2014, the network’s ranks swelled to almost 400 mayors in response to the Trump administration’s withdrawal from the Paris Agreement. Climate Mayors commit to taking ambitious action to meet each of their cities’ current climate goals, while working together towards achieving our national Paris targets. Climate Mayors is founded and Chaired by Los Angeles Mayor Eric Garcetti, and Co-Chaired by Mayors Sylvester Turner (Houston) and Martin J. Walsh (Boston).
About the Electrification Coalition
The Electrification Coalition (EC) is a non-partisan, not-for-profit group committed to promoting policies and actions that facilitate the deployment of plug-in electric vehicles on a mass scale in order to combat the economic, public health, and national security dangers caused by America’s dependence on oil. The EC works with a variety of stakeholders that represent the entire electrified transportation value chain, positioning the organization as a dedicated rallying point for an array of electrification allies.
FedEx Express Global Lessons Learned

FedEx Express shares lessons learned from global fleet electrification
- EVs are deployed in urban areas with low variability and maximum daily distance
- Two major barriers to fleet adoption are battery right sizing and vehicle life optimization
- EVs require a managed transition for maintenance staff
- Charging infrastructure and maintenance has presented a variety of challenges
- OEM engagement is necessary to diversify range and right-size battery capacity
- Activity conducted since 2005
Case Study Information
Overview
Company: FedEx ExpressType: Light- and Medium-Duty Trucks
Location: London, Los Angeles, San Francisco, Chicago, Memphis, New York, Paris
Case Study Publishing Date: 2012
Fleet Size: 45,000 vehicles
Program Goals: Target 20% improvement in on-road fuel economy by 2020; reduce operational costs in low-emission zones (LEZs) and Congestion Charge Zones (CCZ) globally
Replacement Vehicle Class: Class 1-2, Class 3, Class 4-6 Trucks
Vehicle Use Case: Urban delivery service
Replacement Vehicle Fuel Consumption: N/A
Case Study
Objective: Target 20% improvement in on-road fuel economy by 2020; reduce operational costs in low-emission zones (LEZs) and Congestion Charge Zones (CCZ) globallyVEHICLE OVERVIEW
Number of Vehicles: 97 EVs in 2012
Types of EVs: Smith Electric Vehicles, Navistar, Freightliner, and Ford
EV Deployment Timeline:
CHARGING OVERVIEW
Charging Infrastructure: FedEx limits the number of vehicles and chargers deployed at each facility to mitigate costs. Deployments are designed to ensure off peak charging does not exceed an individual facility’s peak load to avoid excessive demand charges.
Charging Infrastructure Costs: $10,000 per level for charging equipment including hardware and installation
OPERATIONS & MAINTENANCE
Capital Costs: Purchase prices remain high for EVs; to reduce this, FedEx is working directly with OEMs to diversify range and right-size battery capacity to more closely fit route needs. For example, urban trucks may only require 15-20 miles, not 100 mile range as is the case with most EVs today.
Operations & Maintenance Costs: N/A
TRAINING & CHANGE MANAGEMENT
Training: OEM-level trainings are conducted regularly
Change Management: EVs require a managed transition for maintenance staff; initial concerns existed for performance and cost-effectiveness.
Summary
Lessons Learned:Next Steps:
References
Case Study SourceNigro, Nick, Seki, Stephanie. Atlas Public Policy. Electrifying Ride-Hail Services September 2018. http://evsharedmobility.org/wp-content/uploads/2018/09/Electrifying_Ride-Hail_Services.pdf
About Atlas Public Policy
Atlas Public Policy’s mission is to equip businesses and policymakers to make strategic, informed decisions through the greater use of technology that aggregates publicly available information. Atlas arms our audience with the information necessary to encourage the use of new technologies and products along with changes in consumer behavior.
Image source:
GM. https://media.gm.com/media/us/en/gm/home.detail.html/content/Pages/news/us/en/2018/mar/0302-maven-austin.html
Charlotte, North Carolina Municipal Fleet Electrification
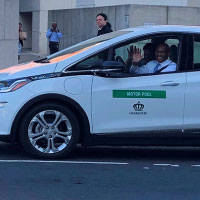
Mobilizing plans for all City fleet and facilities to be fueled by 100% zero-carbon sources by 2030 in Charlotte, North Carolina
- The City's Sustainable and Resilient Fleet Policy was critical to guide electrification plans
- The policy requires EV prioritization in fleet replacements wherever practical
- The policy also includes fleet right-sizing and route optimization
- EV business cases require a total cost of ownership evaluation
- Heavy-duty EV applications remain limited due to lack of supply
- A policy-first approach to EV electrification allows for large-scale transitions
- Telematics data has been critical to modeling business cases and identifying candidate vehicles
- Activity conducted since 2012
Case Study Information
Overview
Company: City of CharlotteType: Municipal fleet, charging infrastructure
Location: Charlotte, North Carolina
Case Study Publishing Date: October 2020
Fleet Size: 5,500 vehicles including 2,700 light-duty vehicles and 700 heavy-duty vehicles
Program Goals: Municipal fleet electrification aligned with the City's sustainability goals
Replacement Vehicle Class: Light-duty vehicles
Vehicle Use Case: Short-distance travel by the City employees
Replacement Vehicle Fuel Consumption: N/A
Case Study
Objective: Test and evaluate the real-world driving conditions and total cost of ownership for fleet electrification. In partnership with the Climate Mayors Electric Vehicle Purchasing Collaborative and telematics company, Sawatch, the City deployed telematics on ten potential EV candidate vehicles during 2019.VEHICLE OVERVIEW
Number of Vehicles: 42
Types of EVs: Various; procurement via the Climate Mayors Electric Vehicle Purchasing Collaborative
EV Deployment Timeline: Beginning in 2019; test pilot was completed for 90 days
CHARGING OVERVIEW
Charging Infrastructure: Public charging installation began in 2012; networked EVSE was installed in 10 target locations
Charging Infrastructure Costs: N/A
OPERATIONS & MAINTENANCE
The following data was captured and modeled from ten real-world ICE vehicles using telematics data to inform projected savings by replacing the top five candidate vehicles
Capital Costs: N/A
Operations & Maintenance:
TRAINING & CHANGE MANAGEMENT
Training: N/A
Change Management: The use of telematics data to model savings and applications has allowed for efficiencies in transitioning fleets at scale
Summary
Program Results:Lessons Learned:
Next Steps:
References
Case Study SourceThe Climate Mayors Electric Vehicle Purchasing Collaborative (the Collaborative). Municipal Fleet Electrification: A case Study of Charlotte, NC October 2020. https://driveevfleets.org/wp-content/uploads/2018/09/Charlotte-Case-Study-Final-11.9.2020.pdf
About the Climate Mayors Electric Vehicle Purchasing Collaborative
The Climate Mayors Electric Vehicle Purchasing Collaborative (the Collaborative) is a joint effort by Climate Mayors, the Electrification Coalition, and Sourcewell working toward accelerating the transition of city fleets to electric vehicles (EVs). By creating a new and innovative cooperative purchasing mechanism, the Collaborative is reducing major barriers to fleet electrification for cities and other public agencies. In addition to an innovative cooperative purchasing option, the Collaborative offers a host of technical resources, analyses, and staff support, which reduces major obstacles to fleet electrification.
About Climate Mayors
Representing over 74 million Americans from 48 states, Climate Mayors is a diverse network of 466 U.S. city mayors who have committed to fighting climate change. Originally founded in 2014, the network’s ranks swelled to almost 400 mayors in response to the Trump administration’s withdrawal from the Paris Agreement. Climate Mayors commit to taking ambitious action to meet each of their cities’ current climate goals, while working together towards achieving our national Paris targets. Climate Mayors is founded and Chaired by Los Angeles Mayor Eric Garcetti, and Co-Chaired by Mayors Sylvester Turner (Houston) and Martin J. Walsh (Boston).
About the Electrification Coalition
The Electrification Coalition (EC) is a non-partisan, not-for-profit group committed to promoting policies and actions that facilitate the deployment of plug-in electric vehicles on a mass scale in order to combat the economic, public health, and national security dangers caused by America’s dependence on oil. The EC works with a variety of stakeholders that represent the entire electrified transportation value chain, positioning the organization as a dedicated rallying point for an array of electrification allies.
Image Source
City of Charlotte. https://charlottenc.gov/Pages/CitySpotlight/Drive_electric.aspx
Massachusetts Pilot for Electric School Bus Deployments
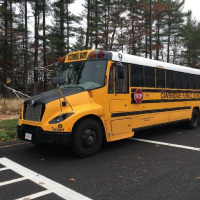
Massachusetts Department of Energy Resources partners with three school districts to test battery electric buses in cold weather environments
- Electric school buses present a viable vehicle technology for school bus operations
- Electric school buses produce fewer greenhouse gases versus diesel school buses
- Key learning for importance of facilitating vehicle and charging infrastructure procurement in tandem
- Fueling costs were not lower for the electric school buses than traditional diesel buses
- Bus efficiency ranged from 1.3-1.4 kWh per mile with a 70-80 mile range
- Unmanaged charging and high vampire loads resulted in excess demand
- Managed charging identified as critical to total cost of ownership
- Bus operating efficiency tended to be lower in lower temperatures
- Electric buses encountered a number of mechanical and logistical challenges
- OEM engagement was critical for pilot success and future product development
- Level 2 charging was deemed cost effective charging for the pilot
- V2G or V2B (Vehicle to Grid/Building) electric school bus systems determined not yet cost-effective
- Pilot underscores value of training and change management planning for EV deployments
- Activity conducted from Fall 2015 through February 2018
Case Study Information
Overview
Company: Massachusetts Department of Energy Resources (DOER) with funding from the Regional Greenhouse Gas Initiative and support from Vermont Energy Investment Corporation. Participating School Districts include Amherst Regional Public School District (Amherst), Cambridge Public School District (Cambridge), and Concord Public School District (Concord)Type: School Buses
Location: Massachusetts
Case Study Publishing Date: April 20, 2018
Fleet Size: Various
Program Goals: Compare real-world GHG reductions, fuel efficiency benefits, operational costs compared to diesel buses, and V2G capabilities for a school district bus electrification. Further, evaluate EV school bus viability and technology in cold weather environments.
Fleet Conversion Vehicles: Diesel school buses
Replacement Vehicle Class Class C school buses
Vehicle Use Case: Student busing between 35-45 miles per day
Replacement Vehicle Fuel Consumption: N/A
Case Study
Objective: Amherst Regional Public School District (Amherst), Cambridge Public School District (Cambridge), and Concord Public School District (Concord) deployed one electric school within their school district as a first-of-its-kind cold weather pilot for 279 days.VEHICLE OVERVIEW
Number of Vehicles: 3; 1 per participating school district
Types of EVs: Lion eLion Class C battery electric school bus with 104 kWh battery and 75 mile range
EV Deployment Timeline:
Miles Driven: 13,902 miles
CHARGING OVERVIEW:
Charging Infrastructure: Level 2
Original pilot called for bidirectional charging (V2G or V2x); however technology was deemed cost prohibitive. Cost estimates ranged from $162,500 – $227,500 for on board system requirements, and $140,400 - $270,400 for off board system requirements.
Charging Infrastructure Cost: $3,000-$10,000
OPERATIONS & MAINTENANCE
Capital Costs: $327,500 per vehicle
The project included $400,000 in grants
Operations & Maintenance Costs:
TRAINING & CHANGE MANAGEMENT
Training: School districts experienced challenges with inadequate training
Change Management: Charging costs were estimated to be 63% higher than necessary inadequate change management
Summary
Program Results:Lessons Learned:
Next Steps:
References
Case Study SourceVermont Energy Investment Corporation. Electric School Bus Pilot Project Evaluation. https://www.mass.gov/files/documents/2018/04/30/Mass%20DOER%20EV%20school%20bus%20pilot%20final%20report_.pdf
Alternative Fuels Data Center. Case Study: Massachusetts School Fleets Get Answers through Electric Bus Testing. https://afdc.energy.gov/case/3092
About Massachusetts Clean Cities
The Massachusetts Clean Cities works with vehicle fleets, fuel providers, community leaders, and other stakeholders to save energy and promote the use of domestic fuels and advanced vehicle technologies in transportation.
Image source:
Alternative Fuels Data Center. https://afdc.energy.gov/case/3092
King County Metro Electric Bus Pilot

Evaluating cost effectiveness and environmental savings of fleet electrification battery electric vehicles within Seattle, Washington
- Electric buses present a viable vehicle technology for public transit operations
- Battery Electric Buses (BEBs) produce fewer greenhouse gases versus diesel buses
- BEBs maintenance costs were 44% less than that of diesel equivalent buses and 17.8% less than hybrid buses
- BEBs fuel economy was lower than diesel equivalent buses due to fuel prices and excessive energy demand charges
- BEBs fuel economy was 2.84 kWh/mile or 13.3 miles per diesel gallon equivalent
- Comparable diesel buses realized 5.1 miles per diesel gallon equivalent
- Maintenance costs were $.26 per mile total for battery electric buses with an 80.6% average availability
- Diesel equivalent buses realized $.46 per mile with an 86.4% average availability
- Hybrid equivalent buses realized $.32 per mile with a 90.5% average availability
- Charging is critical to effective operations including on-route and in-depot
- Maintenance teams experienced parts issues in effectively maintaining the BEB fleet
- Activity conducted from April 2016 - March 2017
Case Study Information
Overview
Company: King County Metro (KCM)Location: Seattle, Washington
Case Study Publishing Date: February 2018
Fleet Size: 1,540 buses
Program Goals: Reduce energy consumption and greenhouse gas emissions
Fleet Conversion Vehicles: Diesel trolley replicas at the end of their expected service life
Replacement Vehicle Class 40' public transit buses - diesel, hybrid and an electric trolley
Vehicle Use Case: Public transportation on an 18.6 mile loop
Replacement Vehicle Fuel Consumption: 5.3 miles per gallon for diesel, 6.3 miles per gallon equivalent for hybrid, and 14.7 miles per gallon equivalent for trolley
Case Study
Objective: In February 2016 King County Metro (KCM) began operating a fleet of four battery electric buses (BEBs) in its service area. Performance was tracked and analyzed from April 2016 through March 2017.VEHICLE OVERVIEW
Number of Vehicles: 3
Types of EVs: Proterra’s 40-foot Catalyst BEB
EV Deployment Timeline:
CHARGING OVERVIEW:
Charging Infrastructure: Fast Charger
Charging Infrastructure Cost: N/A
OPERATIONS & MAINTENANCE
Capital Costs: $797,882 per vehicle
Operations & Maintenance Costs:
TRAINING & CHANGE MANAGEMENT
Training: Training was conducted for staff and operators; challenges existed due to unique use case for BEBs
Change Management: Deploying BEBs presents a new technology for for transit staff to take over all maintenance responsibilities; parts availability became a common issue for KCM maintenance staff during the pilot
Summary
Program Results:Lessons Learned:
Next Steps:
References
Case Study SourceEudy, Leslie and Jeffers, Matthew. National Renewable Energy Laboratory. Zero-Emission Bus Evaluation Results:
King County Metro Battery Electric Buses. https://www.transit.dot.gov/sites/fta.dot.gov/files/docs/research-innovation/115086/zero-emission-bus-evaluation-results-king-county-metro-battery-electric-buses-fta-report-no-0118.pdf
About King County Metro (KCM)
King County Metro (KCM) provides public transit service to King County, Washington. Its service area covers more than 2,000 square miles, including the Seattle metro area, and contains more than 2 million residents. KCM’s bus fleet operates on 215 routes and serves approximately 395,000 passengers each weekday, on average. This fleet of 1500+ vehicles contains buses of several different propulsion types, including standard and hybrid diesel buses, battery electric buses, and electric trolley buses.
Project Stakeholders: U.S. Federal Transit Administration (FTA), National Renewable Energy Laboratory (NREL), U.S. Department of Transportation (DOT), DOT’s Research, Development, and Technology Office (OST-R)
Image source:
King County Metro. kingcounty.gov
Foothill Transit Battery Electric Bus Demonstration Results

Taking the first step toward transitioning Foothill Transit’s fleet to 100% electric by 2030
- Foothill Transit's first deployment of Battery electric buses (BEB)
- BEBs can achieve 8 times higher fuel economy in comparison to CNG buses
- Total maintenance costs were $0.14/mi for BEBs and $0.20/mi for CNG buses
- Fleet management software mitigated demand charges to effectively manage energy costs
- Foothill Transit earned approximately $126,000 of Low Carbon Fuel Standard (LCFS) credits
- On-route fast chargers operated reliably with minimal issues and vehicle downtime
- Foothill Transit reports there’s still a lot of learning as the agency ramps up to a larger BEB fleet
- Activity conducted from March 2014 through December 2016
Case Study Information
Overview
Company: Foothill TransitType: Public Transit
Location: San Gabriel and Pomona Valley region of Los Angeles County, California
Case Study Publishing Date: June 2017
Fleet Size: 376 buses
Program Goals: Test performance and viability of battery electric buses (BEBs) on a dedicated route
Fleet Conversion Vehicles: CNG buses
Replacement Vehicle Class: Public transit bus
Vehicle Use Case: The BEB fleet operates on Line 291, a 16.1-mile route that travels between La Verne and Pomona; the line serves a transit dependent community and has high ridership
Replacement Vehicle Fuel Consumption: 2.1 miles per diesel gallon equivalent
Case Study
Objective: After an initial demonstration in 2014, Foothill Transit purchased twelve next-generation BEBs from Proterra through a $10.2 million grant under the Federal Transit Administration’s (FTA’s) Transit Investments for Greenhouse Gas and Energy Reduction (TIGGER) Program. Foothill Transit began operating the fleet of 12 battery electric buses (BEBs) on its Line 291, a 16.1-mile route that travels between La Verne and Pomona and routes through Pomona Transit Center where one fast charger is located for on route charging.VEHICLE OVERVIEW
Number of Vehicles: 12
Types of EVs: Proterra 35’ composite body buses with on-route charging capabilities
EV Deployment Timeline:
Miles Driven: BEBs operated 501,037 miles over 58,497 hours of operation
CHARGING OVERVIEW
Charging Infrastructure: Two Eaton 500 kW DCFC chargers, with two charge heads, capable of charging in less than 10 minutes per bus
Charging Infrastructure Cost: $665,000 (install and charger); Foothill Transit has a contract with Proterra to maintain the chargers and associated equipment at a cost of $1,500 per month
OPERATIONS & MAINTENANCE
Capital Costs: $904,490
Foothill Transit purchased the buses in 2013 with delivery in 2014. However, the purchase price for BEBs continues to decrease over time, Foothill Transit costs have dropped from $1.2 million to just under $800,000 per BEV
Operations & Maintenance Costs:
TRAINING & CHANGE MANAGEMENT
Training: Training was conducted for drivers, operations, and maintenance staff
Change Management: Deployment and training were relatively simple with no challenges
Summary
Lessons Learned:Next Steps:
References
Case Study SourceLeslie Eudy, L., and & Jeffers, M (2017). National Renewable Energy Laboratory. Foothill Transit Battery Electric Bus Demonstration Results: Second Report. https://www.nrel.gov/docs/fy17osti/67698.pdf
About NREL
NREL is a national laboratory of the U.S. Department of Energy Office of Energy Efficiency & Renewable Energy. Operated by the Alliance for Sustainable Energy, LLC. The full case study is available at no cost from the National Renewable Energy
Laboratory (NREL) at www.nrel.gov/publications.
Image source:
CalTransit. https://caltransit.org/about/50-years/member-profiles/foothill-transit/
Amazon.com Global Test Pilot for Light-Duty Urban Logistics

Testing cost-effectiveness of delivery fleet electrification to achieve long-term energy and sustainability goals
- 100% of all tailpipe emissions have been eliminated
- Fuel savings were more than 50% in Europe
- Real-world range was 19% lower than standardized testing
- Fuel economy ranged from 44 - 145 miles per diesel gallon equivalent (MPDGE)
- Charge management software is critical to managing demand charges
- Driver feedback has been mixed
- Global EV fleets will be critical to cost-effective operations in low emission zones
- Last miles delivery is a suitable application for fleet electrification
- Amazon.com recommends fleets pursue electrification for urban delivery trucks
- Activity conducted from June through December 2018
Case Study Information
Overview
Company: Amazon.comType: Urban logistics / delivery trucks
Location: France, Italy, and Spain
Case Study Publishing Date: N/A
Fleet Size: 30,000 delivery vehicles and 20,000 branded trailers
Program Goals: Test operational impacts for electric delivery vans within three target markets to enable the transition of EVs and work toward achieving Amazon's long-term goal of powering its global infrastructure using 100% renewable energy
Fleet Conversion Vehicles: Mixed; diesel and gas Class 1 and Class 2 urban delivery vans
Replacement Vehicle Class Class 1 urban delivery vans
Vehicle Use Case: Local, short-distance delivery with low speeds and high stopping frequency
Replacement Vehicle Fuel Consumption: XXX
Case Study
Objective: Test real-world implications of EV fleet electrification by deploying Class 1 delivery vans equipped with telematics in three target city's worldwide including Paris, Milan and Madrid representing a wide range of operating temperaturesVEHICLE OVERVIEW
Number of Vehicles: N/A
Types of EVs: Multiple EV models were operated and monitored
EV Deployment Timeline: June and December 2018
Miles Driven: >20,000 miles
CHARGING OVERVIEW:
Charging Infrastructure: Level 2 charging
Charging Infrastructure Cost: N/A
OPERATIONS & MAINTENANCE
Capital Costs: EV procurement costs were 20-50% higher
Operations & Maintenance Costs: Maintenance was not a primary objective of this testing and not actively tracked
TRAINING & CHANGE MANAGEMENT
Training: Basic training was provided, no special training requirements
Change Management: Driver feedback has been mixed; concerns existed for range anxiety and performance
Summary
Program Results:Lessons Learned:
Next Steps:
References
Case Study SourceBusiness for Social Responsibility (BSR). Amazon.com: EV Case Study. https://www.bsr.org/en/collaboration/groups/future-of-fuels/case-studies/anderson-dubose-ev-case-study
Image source:
Amazon.com. https://sustainability.aboutamazon.com/environment/sustainable-operations/transportation
Avista Corp. Electric Vehicle Supply Equipment Pilot

Piloting Electric Vehicle Supply Equipment (EVSE) in Avista Corp's service territory to evaluate regional electrification requirements in eastern Washington, northern Idaho and part of southern and eastern Oregon
- EV adoption increased from 23% in 2016 to 41% in 2019
- Pilot participants were highly satisfied with their experience
- Over 53,000 charging sessions were completed and analyzed
- Networked EVSEs proved more expensive to maintain with higher failure rates
- Light-duty EV loads will be manageable
- Utility programs are effective at catalyzing market adoption
- Workplace charging was proven to spur market adoption
- Activity conducted from 2016 - June 2019
Case Study Information
Overview
Company: Avista CorpType: Charging infrastructure
Location: Eastern Washington, northern Idaho and part of southern and eastern Oregon
Case Study Publishing Date: October 18, 2019
Fleet Size: N/A
Program Goals: Test infrastructure requirements to further regional EV goals and advancement
Fleet Conversion Vehicles: N/A
Replacement Vehicle Class: N/A
Vehicle Use Case: N/A
Replacement Vehicle Fuel Consumption: N/A
Case Study
Objective: Avista conducted a three-year Electric Vehicle Supply Equipment (EVSE) pilot in beginning in 2016, with the main objectives of understanding (1) light-duty EV load profiles, grid impacts, costs, and benefits, (2) how the utility may better serve all customers in the electrification of transportation, and (3) begin to support early EV adoption in its service territories. Networked and non-networked charging equipment was procured from six different manufacturers and installed in residential and commercial properties across Avista's service territory. A total of 439 EVSE charging ports were installed in a variety of locations, including 226 residential, 123 workplace, 24 fleet, 20 multiple-unit dwelling, and 7 DC fast charging sites.VEHICLE OVERVIEW
Number of Vehicles: N/A
Types of EVs: N/A
EV Deployment Timeline: N/A
Miles Driven: N/A
CHARGING OVERVIEW
Charging Infrastructure: Networked and non-networked Level 2 chargers, Level 3 direct-current fast charger (DCFC)
A total of 439 EVSE charging ports, including 226 residential, 123 workplace, 24 fleet, 20 multiple-unit dwelling, and 7 DC fast charging sites. Charging equipment included:
Charging Infrastructure Cost:
OPERATIONS & MAINTENANCE
Capital Costs: $3.1 million in capital investments
Operations & Maintenance Costs:
TRAINING & CHANGE MANAGEMENT
Training: N/A
Change Management: N/A
Summary
Program Results:Lessons Learned:
Next Steps:
The pilot allowed Avista to be well positioned to propose a comprehensive Transportation Electrification Plan in both Washington and Idaho service territories, that includes major areas of education & outreach, dealer engagement, community & low-income, EVSE infrastructure, load management, commercial fleets, rate design, internal programs, planning, and grid integration
References
Case Study & Image SourceCzerniak, Jon, Farley, Rendell, Vervair, Mike. Avista Corp. Electric Vehicle Supply Equipment Pilot
Final Report October 2019. https://www.myavista.com/-/media/myavista/content-documents/energy-savings/electricvehiclesupplyequipmentpilotfinalreport.pdf?la=en
About Avista
Avista Corporation is an energy company involved in the production, transmission and distribution of energy as well as other energy-related businesses. Its largest subsidiary, Avista Utilities, serves more than 600,000 electric and natural gas customers across 30,000 square miles in eastern Washington, northern Idaho and parts of southern and eastern Oregon.
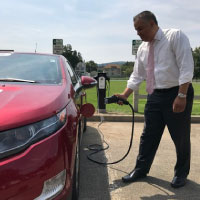
City of Loveland, Colorado Municipal Fleet Electrification
Innovative procurement strategies and public/private partnerships prove positive business case for passenger class EV municipal fleets
- The City has found Battery Electric Vehicles cost 41% less to own and operate than gas-powered vehicles
- EVs have proven to be a cost-effective addition to the municipal fleet for local service needs
- Municipal leasing program was utilized to reduce capital costs
- Vehicle reliability, performance, and range all exceeded initial expectations
- EV cost of driving was $.024 per mile versus $.146 per mile for a gas-powered vehicle
- EV total cost of ownership was $.17 per mile versus $.29 per mile for a gas-powered vehicle
- Activity conducted from September 2012
Case Study Information
Overview
Company: City of LovelandType: Municipal fleet electrification
Location: Loveland, Colorado. A community of 70,000 residents in Northern Colorado
Case Study Publishing Date: September 2013
Fleet Size: 600 vehicles, various classes
Program Goals: Convert 100% of municipal fleet to EVs for vehicles where no heavy use is required and within a 35 mile radius of the city
Fleet Conversion Vehicles: Passenger-class vehicles (~100 vehicles in fleet)
Replacement Vehicle Class: Class 1 passenger vehicle
Vehicle Use Case: Short-distance travel, <20 miles per day, annual mileage 6,000/year
Replacement Vehicle Fuel Consumption: 12 MPG, 500 gallons/year
Case Study
Objective: To combat escalating fuel costs and work to achieve city-wide sustainability goals, the City of Loveland began implementing EVs into their municipal fleet to evaluate cost effectiveness and overall benefits from alternative-fuel vehicle procurement.VEHICLE OVERVIEW
Number of Vehicles: 5
Types of EVs: Nissan LEAF
EV Deployment Timeline: The City unveils its first EV fleet additions in September 2012
Miles Driven: 4,000 and 2,000 miles for each vehicle within the first seven months of operation
CHARGING OVERVIEW
Charging Infrastructure: Three Level 2 chargers; 5:3 vehicle-to-charger ratio
Charging Infrastructure Cost: N/A
OPERATIONS & MAINTENANCE
Capital Costs: The City leveraged Nissan’s municipal lease program over a three year term; the program allowed the federal EV tax credit ($7,5000 per vehicle) to be incorporated into the lease directly.
Operations & Maintenance Costs:
TRAINING & CHANGE MANAGEMENT
Training: Training was conducted for drivers
Change Management: Initial concerns existed for range anxiety, performance and reliability
Summary
Lessons Learned:Next Steps:
References
Case Study SourceElectrification Coalition Case Study. The City of Loveland: Marrying Functionality and Economics. https://driveevfleets.org/wp-content/uploads/2018/08/Loveland_Case_Study_092613.pdf
The City of Loveland
https://www.cityofloveland.org/
Drive Electric Northern Colorado
http://driveelectricnoco.org/
Image source:
Jenny Sparks / Loveland Reporter-Herald, https://www.reporterherald.com/2014/02/28/electric-car-push-continues-in-loveland/
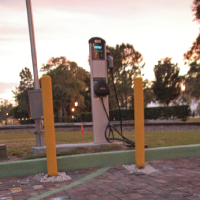
Binghamton, New York Municipal Fleet Electrification
The first municipal fleet procurement with the Climate Mayors Electric Vehicle Purchasing Collaborative in the City of Binghamton, New York
- The City of Binghamton successfully integrated two EVs into their fleet
- The City was able to bypass traditional public bid to procure EVs
- Municipal fleet use helps drive adoption through endorsement and credibility
- Binghamton was the first city to leverage The Climate Mayors Electric Vehicle Purchasing Collaborative
- Activity conducted in April 2019
Case Study Information
Overview
Company: City of BinghamtonType: Municipal fleet, charging infrastructure
Location: Binghamton, New York
Case Study Publishing Date: March 2020
Fleet Size: 300 vehicles
Program Goals: Municipal fleet electrification aligned with the City's sustainability goals
Replacement Vehicle Class: Light-duty vehicles
Vehicle Use Case: Short-distance travel by the City's planning department
Replacement Vehicle Fuel Consumption: N/A
Case Study
Objective:In 2017 the City became the first southern tier New York city to earn the New York State Energy Research and Development Authority's Clean Energy Community designation, which included a $250,000 grant for sustainability investments. Grant funds were used in support of the City's sustainability goals, including funding allocation for two zero-emission vehicles.VEHICLE OVERVIEW
Number of Vehicles: 2
Types of EVs: Nissan Leaf
EV Deployment Timeline: April 2019
CHARGING OVERVIEW
Charging Infrastructure: Level 2 charging
Charging Infrastructure Costs: $4,385
Charging equipment and installation was paid through a $2,500 New York State Energy Research and Development Authority (NYSERDA) grant and $1,895 from the City's general fund
OPERATIONS & MAINTENANCE
Capital Costs: $50,000
The City leveraged the Climate Mayors Electric Vehicle Purchasing Collaborative for direct municipal purchasing outside of the traditional public bid process
Operations & Maintenance: N/A
TRAINING & CHANGE MANAGEMENT
Training: N/A
Change Management: N/A
Summary
Lessons Learned:Next Steps:
References
Case Study SourceThe Climate Mayors Electric Vehicle Purchasing Collaborative (the Collaborative). Municipal Fleet Electrification: A case Study of Binghampton, NY September 2020. https://driveevfleets.org/wp-content/uploads/2018/09/Binghamton-New-Case-Study-Final-8.31.2020.pdf
The City of Binghampton. Blog post. City Installs Electric Charging Stations Recreation Park http://www.binghamton-ny.gov/city-installs-electric-vehicle-charging-stations-recreation-park
About the Climate Mayors Electric Vehicle Purchasing Collaborative
The Climate Mayors Electric Vehicle Purchasing Collaborative (the Collaborative) is a joint effort by Climate Mayors, the Electrification Coalition, and Sourcewell working toward accelerating the transition of city fleets to electric vehicles (EVs). By creating a new and innovative cooperative purchasing mechanism, the Collaborative is reducing major barriers to fleet electrification for cities and other public agencies. In addition to an innovative cooperative purchasing option, the Collaborative offers a host of technical resources, analyses, and staff support, which reduces major obstacles to fleet electrification.
About Climate Mayors
Representing over 74 million Americans from 48 states, Climate Mayors is a diverse network of 466 U.S. city mayors who have committed to fighting climate change. Originally founded in 2014, the network’s ranks swelled to almost 400 mayors in response to the Trump administration’s withdrawal from the Paris Agreement. Climate Mayors commit to taking ambitious action to meet each of their cities’ current climate goals, while working together towards achieving our national Paris targets. Climate Mayors is founded and Chaired by Los Angeles Mayor Eric Garcetti, and Co-Chaired by Mayors Sylvester Turner (Houston) and Martin J. Walsh (Boston).
About the Electrification Coalition
The Electrification Coalition (EC) is a non-partisan, not-for-profit group committed to promoting policies and actions that facilitate the deployment of plug-in electric vehicles on a mass scale in order to combat the economic, public health, and national security dangers caused by America’s dependence on oil. The EC works with a variety of stakeholders that represent the entire electrified transportation value chain, positioning the organization as a dedicated rallying point for an array of electrification allies.
Image Source
City of Binghampton. http://www.binghamton-ny.gov/city-installs-electric-vehicle-charging-stations-recreation-park
Public Transit Trolley Pilot in San Francisco Bay Area

Evaluating cost effectiveness and fleet electrification viability for battery electric vehicles within the San Francisco Bay Area
- Electric buses present a viable vehicle technology for public transit operations
- Electric buses produce fewer greenhouse gases versus diesel buses
- County Connection will reduce its emissions by over 154 tons of CO2 per year
- Maintenance costs for Battery Electric Busses (BEBs) were 13% less than that of diesel equivalent buses
- The battery fleet’s fuel economy was 3.8 times higher than diesel equivalent buses
- The agency plans to save nearly $50,000 per year in fuel savings
- BEBs fuel economy was 2.84 kWh/mile or 13.3 miles per diesel gallon equivalent
- Comparable diesel buses realized 5.1 miles per diesel gallon
- Maintenance costs were $.39 per mile total for battery electric buses with a 76.9% average availability
- Diesel equivalent buses realized $.44 per mile with a 85.5% average availability
- On-route charging is critical to effective operations
- Maintenance teams were unable to take-on end-to-end responsibilities to fully maintain BEBs
- OEM engagement is critical to advancing vehicle and charging requirements based on real-world driving conditions
- Activity conducted from June 2017 - May 2018
Case Study Information
Overview
Company: Central Contra Costa Transit Authority (County Connection)Location: San Francisco Bay Area, California
Case Study Publishing Date: December 2018
Fleet Size: 121 fully accessible transit buses and 63 paratransit vehicles
Program Goals: Evaluate cost effectiveness and fleet electrification viability for battery electric vehicles within public transit
Fleet Conversion Vehicles: Diesel trolley replicas at the end of their expected service life
Replacement Vehicle Class Public transit trolley bus
Vehicle Use Case: Public transportation on a free circulator route through San Francisco
Replacement Vehicle Fuel Consumption: 3.1 miles per gallon
Case Study
Objective: In January 2017 County Connection began operating a fleet of four battery electric buses (BEBs) in its service area. Performance was tracked and analyzed from June 2017 through May 2018.VEHICLE OVERVIEW
Number of Vehicles: 4
Types of EVs: Gillig/BAE Systems 29-ft Trolley-replica buses built by Gillig with BAE electric propulsion system
EV Deployment Timeline:
Miles Driven: 65,000
CHARGING OVERVIEW:
Charging Infrastructure: Level 2, WAVE induction charging
Two plug-in chargers at the facility for overnight charging averaging 126 minutes for total charge time per vehicle
One 50-kW WAVE inductive charging pad for wireless charging during scheduled layovers; average charge time of 6.9 minutes
Charging Infrastructure Cost: ~$105,000
OPERATIONS & MAINTENANCE
Capital Costs: $1,053,689 per vehicle
The project was funded from a $4.32million FTA Clean Fuels grants
Operations & Maintenance Costs:
TRAINING & CHANGE MANAGEMENT
Training: Training was conducted for staff and operators
Change Management: Deploying BEBs presents a new technology for for transit staff to take over all maintenance responsibilities after the warranty period ends; staff did not have the skill set needed to fully maintain BEBs
Summary
Program Results:Lessons Learned:
Next Steps:
References
Case Study SourceEudy, Leslie and Jeffers, Matthew. National Renewable Energy Laboratory. Zero-Emission Bus Evaluation Results:
County Connection Battery Electric
Buses. https://www.nrel.gov/docs/fy19osti/72864.pdf
About Central Contra Costa Transit Authority (County Connection)
County Connection provides fixed-route and paratransit bus service for communities in Central Contra Costa County.
Project Stakeholders: The U.S. Department of Transportation’s (DOT), DOT’s Research, Development, and Technology Office (OST-R), Federal Transit Administration (FTA), U.S. Department of Energy (DOE), DOE’s National Renewable Energy Laboratory (NREL)
Image source:
County Connection. http://countyconnection.com/wp-content/uploads/2019/01/DSCN1339-R--1024x768.jpg
Multi-Family Condominium Charging in California

Implementing multi-family charging for an 18-unit condominium property in Rolling Hills Estates, California
- Utility Charge Ready program was critical to program success
- Resident cooperation is critical for successful on-site implementation
- Multiple-head charging allowed residents to reduce charging equipment costs
- Charging equipment installation was fast and easy with minimal disruption to residents
- On-site charging has increased the property value
- On-site charging has incentivized more residents to choose electric vehicles
- Activity conducted in 2019
Case Study Information
Overview
Company: Silver Spur Court CondosType: Multi-family charging
Location: Rolling Hills Estates, California
Case Study Publishing Date: August 2019
Fleet Size: N/A
Program Goals: Bring on-site charging to Silver Spur Court
Fleet Conversion Vehicles: N/A
Replacement Vehicle Class N/A
Vehicle Use Case: N/A
Replacement Vehicle Fuel Consumption: N/A
Case Study
Objective: Two-phase implementation of charging infrastructureVEHICLE OVERVIEW
Number of Vehicles: N/A
Types of EVs: Light-duty passenger class
EV Deployment Timeline: N/A
Miles Driven: N/A
CHARGING OVERVIEW:
Charging Infrastructure: Level 2 charging; 27 charging ports deployed in two phases
Charging Infrastructure Cost:
The HOA utilized Southern California Edison’s Charge Ready program to help guide and administer the program. The Charge Ready program provides for the procurement and installation of make-ready EV charging infrastructure including transformers, panels and conduit. Once fully completed, owners paid a small fraction of the project cost.
OPERATIONS & MAINTENANCE
Capital Costs: N/A
Operations & Maintenance Costs:
HOA residents were able to lower their overall individual cost by strategically positioning the two-port charging stations to serve two parking spaces, cutting the number of charging stations they needed to install in half.
TRAINING & CHANGE MANAGEMENT
Training: Basic training was provided to residents
Change Management: No special requirements were required for change management
Summary
Program Results:Lessons Learned:
Next Steps:
References
Case Study SourceSouthern California Edison. Charge Ready Case Study: Silver Spur Court Condos 2019. https://www.sce.com/sites/default/files/inline-files/2019.08.26_Silver%20Spur%20Condo%20Case%20Study.pdf
Image source:
Southern California Edison. https://www.sce.com/sites/default/files/inline-files/2019.08.26_Silver%20Spur%20Condo%20Case%20Study.pdf
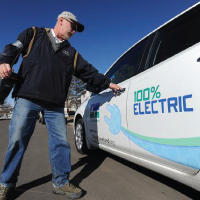
Ride-sharing Electrification Feasibility with Maven Gig

Evaluating the EV use case for ride-sharing services nationally with GM's Maven Gig
- Maven Gig deployed ~1,000 Bolt EVs on their ride-sharing platform starting in April 2017
- EVs were available for a 15% premium weekly rental rate
- EVs drove a total of 21 million electric miles averaging 125 miles per day, per car
- EVs were preferred by drivers and were one of the most popular vehicles
- 223,000 DCFC charging events were completed resulting in 6.59 Million kWh
- Drivers primarily charged Bolt EVs at public EVgo stations
- Most cities at the time did not have enough fast charging infrastructure to support rapid electrification of ride-share vehicles
- Ride-sharing provides a key channel for OEMs to advance consumer awareness and adoption
- As an early adopter in mobility services, Maven Gig planned to continue to build a sustainable business model that included EV fleets; however, as of April 2020, GM closed the ride-sharing program
- Activity conducted from April 2017 - April 2020
Case Study Information
Overview
Company: Maven GigType: Ride-sharing
Location: London, Los Angeles, San Francisco, San Diego, Austin, Baltimore, Boston, Washington, DC
Case Study Publishing Date: September 2018
Fleet Size: 190,000 members
Program Goals: Evaluate EV use case for ride-sharing services. Demonstrate a consistent demand for public charging to encourage more infrastructure deployments from charging service providers.
Replacement Vehicle Class: Passenger vehicles
Vehicle Use Case: Ride-sharing
Replacement Vehicle Fuel Consumption: N/A
Case Study
Objective: Evaluate fleet electrification possibilities for Maven gig's ride-sharing use case starting with a pilot in three target markets of Los Angeles, San Diego and San Francisco.VEHICLE OVERVIEW
Number of Vehicles: 190 EVs druing initial launch, including ~50 in Los Angeles, ~40 in San Diego, and ~100 in San Francisco
Types of EVs: Chevrolet Bolt
EV Deployment Timeline:
CHARGING OVERVIEW
Charging Infrastructure: Public charging was used as the primary means of charging vehicles
Charging Infrastructure Costs: Maven partnered with charging provider EVgo to offer EV drivers unlimited access to fast charging stations on EVgo’s network
OPERATIONS & MAINTENANCE
Capital Costs: Flat weekly rental rates including unlimited miles, maintenance, and insurance coverages. EV weekly rental rates included unlimited charging at any EVgo charging station and select regional charging networks. EVs were listed for a 15% premium over gasoline-powered vehicles.
Operations & Maintenance Costs: N/A
TRAINING & CHANGE MANAGEMENT
Training: N/A
Change Management: N/A
Summary
Program Results:Lessons Learned:
Next Steps:
References
Case Study SourceElectrification Coalition. EV Case Study: The Electric Bellwether? 2012. https://www.electrificationcoalition.org/wp-content/uploads/2018/07/FedEx_case_study.pdf
About FedEx Express
FedEx Express is the world’s largest express transportation company, serving customers in more than 220 countries and territories. FedEx Express has been a first-mover on hybrids and plug-in electric vehicles (PEVs), deploying its first hybrids in 2005.
Image source:
FedEx. https://newsroom.fedex.com/newsroom/fedex-closes-in-on-vehicle-fleet-fuel-efficiency-goal-years-ahead-of-schedule/
Frito-Lay Charging Infrastructure Pilot
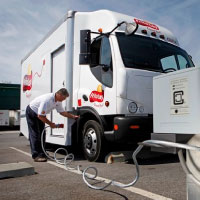
Frito-Lay pilots EVSE installation in its distribution center in Fort Worth, Texas
- Level 2 charging is sufficient for short-haul delivery and distribution
- Charge management software is critical for larger fleet electrification
- Activity conducted from April 2010
Case Study Information
Overview
Company: Frito-LayType: Charging infrastructure
Location: Bakersfield, CA
Case Study Publishing Date: N/A
Fleet Size: The world’s seventh-largest privately-owned fleet; EVs represented 330 trucks as of case study
Program Goals: Test infrastructure requirements to further EV goals
Fleet Conversion Vehicles: N/A
Replacement Vehicle Class: N/A
Vehicle Use Case: N/A
Replacement Vehicle Fuel Consumption: N/A
Case Study
Objective: Install ten (10) EV charging stations including load-monitoring equipment and charging monitoring software at Frito-Lay's distribution center in Forth Worth, TexasVEHICLE OVERVIEW
Number of Vehicles: 330 EVs
Types of EVs: Smith Newton battery-electric distribution trucks with 100 mile range
EV Deployment Timeline: 2010
Miles Driven: N/A
CHARGING OVERVIEW
Charging Infrastructure: Level 2 chargers
Charging Infrastructure Cost: Frito-Lay contracted Chateau Energy Solutions for a turn-key design and installation program including charge management software
OPERATIONS & MAINTENANCE
Capital Costs: N/A
Operations & Maintenance Costs:N/A
TRAINING & CHANGE MANAGEMENT
Training: Training was conducted for site personnel
Change Management: N/A
Summary
Program Results:Lessons Learned:
Next Steps:
References
Case Study SourceChateau Energy Solutions. Frito-Lay Plugs in to the Demand for Electric Vehicle Fleet Trucks https://chateaues.com/insights/case-studies/frito-lay-plugs-in-to-the-demand-for-electric-vehicle-fleet-trucks/
Image source:
Chateau Energy Solutions. https://chateaues.com/insights/case-studies/frito-lay-plugs-in-to-the-demand-for-electric-vehicle-fleet-trucks/
City of Ann Arbor Municipal Fleet Electrification

Demonstrating municipal leadership with fleet electrification following the city’s Green Fleets Policy
- The City of Ann Arbor was able to procure 3 Chevrolet Bolt EVs using a municipal lease program
- The pilot deployment was well received by City staff
- EVs are charged in visible locations to increase public awareness and adoption
- Peer-to-peer sharing and collaboration helped eliminate roadblocks
- Establishing a working partnership with The Climate Mayors Electric Vehicle Purchasing Collaborative was critical to establishing policy and finding creative financing solutions for EV fleet integration
- Activity conducted since 2019
Case Study Information
Overview
Company: The City of City of Ann ArborType: Municipal fleet
Location: Ann Arbor, Michigan
Case Study Publishing Date: June 2020
Fleet Size: 215 vehicles
Program Goals: Municipal fleet EV purchase aligned with Ann Arbor's carbon neutral policy
Replacement Vehicle Class: Class 1 light-duty vehicles
Vehicle Use Case: Short-distance travel by city employees in the motor pool, the water treatment plan, and code enforcement divisions
Replacement Vehicle Fuel Consumption: N/A
Case Study
Objective:After an update to the City's Green Fleets Policy in 2018, the City of Ann Arbor's City Council directed City staff to begin incorporating EVs into their municipal fleet wherever possible. The City established a working partnership with the The Climate Mayors Electric Vehicle Purchasing Collaborative to develop strategies and policies for light-duty fleet electrification. In 2019, the City conducted a pilot to evaluate viability of EV fleet electrification.VEHICLE OVERVIEW
Number of Vehicles: 3
Types of EVs: 2019 Chevrolet Bolt
EV Deployment Timeline: 2019
Ann Arbor’s City Council passed their Climate Action Plan at the end of 2012 with a goal to reduce community-wide emissions by 25% by 2025 and 90% by 2050. At the time, no goals were set for city fleets.
CHARGING OVERVIEW
Charging Infrastructure: Level 2 charging
Charging Infrastructure Costs: N/A
OPERATIONS & MAINTENANCE
Capital Costs: N/A
Operations & Maintenance: N/A
TRAINING & CHANGE MANAGEMENT
Training: N/A
Change Management: N/A
Summary
Lessons Learned:Next Steps:
References
Case Study SourceThe Climate Mayors Electric Vehicle Purchasing Collaborative (the Collaborative). Municipal Fleet Electrification: A case Study of Ann Arbor, MI June 2020. https://driveevfleets.org/wp-content/uploads/2018/09/Ann-Arbor-New-Case-Study-Final-9.10.2020.pdf
About the Climate Mayors Electric Vehicle Purchasing Collaborative
The Climate Mayors Electric Vehicle Purchasing Collaborative (the Collaborative) is a joint effort by Climate Mayors, the Electrification Coalition, and Sourcewell working toward accelerating the transition of city fleets to electric vehicles (EVs). By creating a new and innovative cooperative purchasing mechanism, the Collaborative is reducing major barriers to fleet electrification for cities and other public agencies. In addition to an innovative cooperative purchasing option, the Collaborative offers a host of technical resources, analyses, and staff support, which reduces major obstacles to fleet electrification.
About Climate Mayors
Representing over 74 million Americans from 48 states, Climate Mayors is a diverse network of 466 U.S. city mayors who have committed to fighting climate change. Originally founded in 2014, the network’s ranks swelled to almost 400 mayors in response to the Trump administration’s withdrawal from the Paris Agreement. Climate Mayors commit to taking ambitious action to meet each of their cities’ current climate goals, while working together towards achieving our national Paris targets. Climate Mayors is founded and Chaired by Los Angeles Mayor Eric Garcetti, and Co-Chaired by Mayors Sylvester Turner (Houston) and Martin J. Walsh (Boston).
About the Electrification Coalition
The Electrification Coalition (EC) is a non-partisan, not-for-profit group committed to promoting policies and actions that facilitate the deployment of plug-in electric vehicles on a mass scale in order to combat the economic, public health, and national security dangers caused by America’s dependence on oil. The EC works with a variety of stakeholders that represent the entire electrified transportation value chain, positioning the organization as a dedicated rallying point for an array of electrification allies.
Image Source
City of Ann Arbor Michigan. https://www.a2gov.org/a2energy/homeowner/pages/plug-in-electric-vehicles.aspx
Cincinnati, Ohio Municipal Fleet Electrification
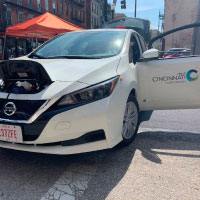
The City of Cincinnati, Ohio discovers cost-effective procurement strategy to begin transitioning EVs into their municipal fleet
- Cincinnati, Ohio was able to procure 3 EVs using a municipal lease program
- By evolving procurement to include municipal leasing options, EV business cases can become more cost justified, reducing initial upfront capital costs and realizing operational savings immediately
- EVs proved to be a cost-effective business case for light-duty vehicles
- Medium- and heavy-duty vehicles will be considered as the market matures
- The City remains focused on deploying EVs in the fleet
- Activity conducted since 2018
Case Study Information
Overview
Company: City of Cincinnati, OhioType: Municipal fleet
Location: Cincinnati, Ohio
Case Study Publishing Date: April 2020
Program Goals: Realize a city-wide goal of reducing greenhouse gas (GHG) emissions by 84% below 2006 levels by 2050, including operating 100% of the city buildings and fleet as carbon neutral by 2035 and tripling renewable energy generation for residents and businesses
Replacement Vehicle Class: Class 1 passenger vehicle
Vehicle Use Case: Parking enforcement vehicles
Replacement Vehicle Fuel Consumption: N/A
Case Study
Objective: The Cincinnati City Council voted to procure EVs as part of the Green Cincinnati Program in December of 2018; in January 2020 the City purchased 3 EVs for a real-world pilot to inform future deploymentsVEHICLE OVERVIEW
Number of Vehicles: 3
Types of EVs: Nissan Leaf, Chevrolet Bolt
EV Deployment Timeline: 2020
CHARGING OVERVIEW
Charging Infrastructure: N/A
Charging Infrastructure Costs: N/A
OPERATIONS & MAINTENANCE
Capital Costs: Vehicles were procured via a municipal lease program through the Climate Mayors Electric Vehicle Purchasing Collaborative
Operations & Maintenance: Based on a sample of 11 vehicles, EVs are estimated to provide a 17% reduction in total cost of ownership
TRAINING & CHANGE MANAGEMENT
Training: N/A
Change Management: Incorporating EVs into a fleet requires dedicated planning and infrastructure improvement
Summary
Program Results:Lessons Learned:
Next Steps:
References
Case Study SourceThe Climate Mayors Electric Vehicle Purchasing Collaborative (the Collaborative). Municipal Fleet Electrification: A case Study of Cincinnati, Ohio 2020. https://driveevfleets.org/wp-content/uploads/2018/09/Cincinnati-Case-Study_April2020.pdf
About the Climate Mayors Electric Vehicle Purchasing Collaborative
The Climate Mayors Electric Vehicle Purchasing Collaborative (the Collaborative) is a joint effort by Climate Mayors, the Electrification Coalition, and Sourcewell working toward accelerating the transition of city fleets to electric vehicles (EVs). By creating a new and innovative cooperative purchasing mechanism, the Collaborative is reducing major barriers to fleet electrification for cities and other public agencies. In addition to an innovative cooperative purchasing option, the Collaborative offers a host of technical resources, analyses, and staff support, which reduces major obstacles to fleet electrification.
About Climate Mayors
Representing over 74 million Americans from 48 states, Climate Mayors is a diverse network of 466 U.S. city mayors who have committed to fighting climate change. Originally founded in 2014, the network’s ranks swelled to almost 400 mayors in response to the Trump administration’s withdrawal from the Paris Agreement. Climate Mayors commit to taking ambitious action to meet each of their cities’ current climate goals, while working together towards achieving our national Paris targets. Climate Mayors is founded and Chaired by Los Angeles Mayor Eric Garcetti, and Co-Chaired by Mayors Sylvester Turner (Houston) and Martin J. Walsh (Boston).
About the Electrification Coalition
The Electrification Coalition (EC) is a non-partisan, not-for-profit group committed to promoting policies and actions that facilitate the deployment of plug-in electric vehicles on a mass scale in order to combat the economic, public health, and national security dangers caused by America’s dependence on oil. The EC works with a variety of stakeholders that represent the entire electrified transportation value chain, positioning the organization as a dedicated rallying point for an array of electrification allies.
Image Source
City of Cincinnati. https://twitter.com/cityofcincy/status/1171097231635755009
City of Austin Municipal Fleet Electrification
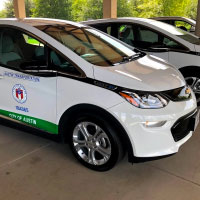
Highlighting light-duty success from an early adopter in municipal fleet electrification
- The City of Austin has been mobilizing on a carbon neutral fleet since 2007
- The City has electrified 5.36% of its fleet
- Telematics is utilized to evaluate vehicle eligibility and model cost savings
- Bulk purchasing and non-traditional procurement has been critical to success
- Model availability for EVs continues to be a barrier for fleet electrification
- Integrated mobility is a cornerstone to the City's carbon neutral strategy
- Activity as of September 2020
Case Study Information
Overview
Company: City of AustinType: Municipal fleet
Location: Austin, Texas
Case Study Publishing Date: September 2020
Fleet Size: 6,000 vehicles including light-, medium-, and heavy-duty trucks, sedans, vans and equipment
Program Goals: Municipal fleet electrification aligned with the City's carbon neutral fleet goals
Replacement Vehicle Class: Light-duty vehicles
Vehicle Use Case: Short-distance travel by city employees
Replacement Vehicle Fuel Consumption: N/A
Case Study
Objective:In 2007, the City of Austin established a goal to achieve a carbon neutral fleet by 2020. The City has been actively working to transition their fleet and utilizes telematics to identify eligible vehicles. Electric vehicles have been allocated across departments to help normalize EVs across the city.VEHICLE OVERVIEW
Number of Vehicles: 300
Types of EVs: Kia Niro, Mitsubishi Outlander PHEV, Chevrolet Bolt, Toyota Prius PRIME, Ford Fusion Energi, Ford F-150 XL PHEV
EV Deployment Timeline: Ongoing since 2007
CHARGING OVERVIEW
Charging Infrastructure: Level 2 charging, public charging
Charging Infrastructure Costs: N/A
OPERATIONS & MAINTENANCE
Capital Costs: The City has leveraged the Climate Mayors Electric Vehicle Purchasing Collaborative for bulk purchasing outside of the traditional public bid process, saving an average of $1,300 per vehicle
Operations & Maintenance: N/A
TRAINING & CHANGE MANAGEMENT
Training: Employee trainings are held to provide practical information and Q&A
Change Management: N/A
Summary
Program Results:Lessons Learned:
Next Steps:
References
Case Study SourceThe Climate Mayors Electric Vehicle Purchasing Collaborative (the Collaborative). Municipal Fleet Electrification: A case Study of Austin, TX September 2020. https://driveevfleets.org/wp-content/uploads/2018/09/Austin-Case-Study-Final-11.13.2020.pdf
About the Climate Mayors Electric Vehicle Purchasing Collaborative
The Climate Mayors Electric Vehicle Purchasing Collaborative (the Collaborative) is a joint effort by Climate Mayors, the Electrification Coalition, and Sourcewell working toward accelerating the transition of city fleets to electric vehicles (EVs). By creating a new and innovative cooperative purchasing mechanism, the Collaborative is reducing major barriers to fleet electrification for cities and other public agencies. In addition to an innovative cooperative purchasing option, the Collaborative offers a host of technical resources, analyses, and staff support, which reduces major obstacles to fleet electrification.
About Climate Mayors
Representing over 74 million Americans from 48 states, Climate Mayors is a diverse network of 466 U.S. city mayors who have committed to fighting climate change. Originally founded in 2014, the network’s ranks swelled to almost 400 mayors in response to the Trump administration’s withdrawal from the Paris Agreement. Climate Mayors commit to taking ambitious action to meet each of their cities’ current climate goals, while working together towards achieving our national Paris targets. Climate Mayors is founded and Chaired by Los Angeles Mayor Eric Garcetti, and Co-Chaired by Mayors Sylvester Turner (Houston) and Martin J. Walsh (Boston).
About the Electrification Coalition
The Electrification Coalition (EC) is a non-partisan, not-for-profit group committed to promoting policies and actions that facilitate the deployment of plug-in electric vehicles on a mass scale in order to combat the economic, public health, and national security dangers caused by America’s dependence on oil. The EC works with a variety of stakeholders that represent the entire electrified transportation value chain, positioning the organization as a dedicated rallying point for an array of electrification allies.
Image Source
City of Austin. https://twitter.com/austintexasgov/status/1144350983591538690/photo/1
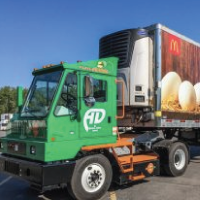
Bolthouse Farms Orange EV Terminal Truck Deployment
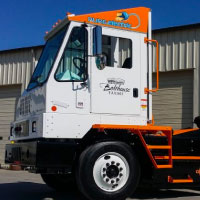
Bolthouse Farms realizes environmental impact, cost savings, and performance gains from terminal truck electrification
- EV terminal trucks had 75% less download and cost 80% less in repairs and maintenance
- Fuel saving were 90% less comparing $15,750 in diesel fuel costs annually versus $1,575 annually for EVs
- State incentives were critical to developing a cost-effective business case for EVs
- Driver and management satisfaction has been high
- Initial skepticism for vehicle performance was overcome by actual results
- OEM collaboration was critical to seamlessly overcoming operational issues
- EVs have helped enhance the brand image of Bolthouse Farms
- Activity conducted from April 2018
Case Study Information
Overview
Company: Bolthouse FarmsType: Terminal Truck Electrification
Location: Bakersfield, CA
Case Study Publishing Date: June 2020
Fleet Size: 1 terminal truck operating in two shifts
Program Goals: Emissions reduction (elimination), cost savings, and operational performance in support of corporate sustainability objectives
Fleet Conversion Vehicles: Diesel terminal truck / yard tractor
Replacement Vehicle Class: Class 8 Heavy-duty truck
Vehicle Use Case: N/A
Replacement Vehicle Fuel Consumption: N/A
Case Study
Objective: Bolthouse Farms added three electric yard trucks and diesel equivalent vehicles to its aging fleet to determine cost-effectiveness and vehicle parity with comparative diesel modelsVEHICLE OVERVIEW
Number of Vehicles: 3
Types of EVs: Orange EV Terminal Truck
EV Deployment Timeline: April 2018
Miles Driven: N/A
CHARGING OVERVIEW
Charging Infrastructure: Level 2 chargers
Charging Infrastructure Cost: Bolthouse Farms is currently working with PG&E's EV Fleet program to help identify additional capacity needs
OPERATIONS & MAINTENANCE
Capital Costs: California HVPI and CORE state purchase incentives reduced the purchase price significantly
Operations & Maintenance Costs:
TRAINING & CHANGE MANAGEMENT
Training: Training was conducted for drivers
Change Management: Initial concerns existed for EV performance and cost-effectiveness
Summary
Program Results:Lessons Learned:
Next Steps:
References
Case Study SourceOrange EV. Bolthouse Farms Presents Case Study of Orange EV Deployments https://orangeev.com/bolthouse-farms-presents-case-study-of-orange-ev-deployments/
ACT News. EXECUTIVE INTERVIEW: Bolthouse Farms Is Achieving Significant Emissions Reductions with Electric Terminal Tractors June 25, 2020. https://www.act-news.com/news/executive-interview-bolthouse-farms-is-adding-electric-terminal-tractor-technology/
Image source:
Orange EV. https://orangeev.com/bolthouse-farms-presents-case-study-of-orange-ev-deployments/
Anderson-DuBose Terminal Truck Deployment
Anderson-DuBose realizes environmental impact, cost savings, and performance gains from terminal truck electrification
- 100% of all tailpipe emissions have been eliminated
- Driver satisfaction was high
- The EV terminal truck fully met performance objectives
- Net fuel savings were ~88% of what was previously spent on diesel fuel
- EV charging cost is $1.83 per day compared to ~$15.80 in diesel fuel
- Maintenance savings are ~$7.61 per day
- No special training or maintenance requirements were experienced
- Anderson-DuBose recommends fleets pursue terminal truck electrification
- Activity conducted from July 2017 through June 2018
Case Study Information
Overview
Company: Anderson-DuBoseType: Terminal Truck Electrification
Location: Rochester, NY
Case Study Publishing Date: January 2019
Fleet Size: 1 terminal truck operating in two shifts
Program Goals: Emissions reduction (elimination), cost savings, and operational performance in support of corporate sustainability objectives
Fleet Conversion Vehicles: Diesel terminal truck / yard tractor
Replacement Vehicle Class: Class 8 Heavy-duty truck
Vehicle Use Case: Repositioning cargo trailers in two shift operation at distribution center
Replacement Vehicle Fuel Consumption: N/A
Case Study
Objective: Immediate deployment of a pure electric terminal truck to replace its diesel terminal truck in daily operations.VEHICLE OVERVIEW
Number of Vehicles: 1
Types of EVs: Orange EV Terminal Truck
EV Deployment Timeline: July 1, 2017 to June 30, 2018
Miles Driven: 796 miles
CHARGING OVERVIEW
Charging Infrastructure: Level 2 in-depot chargers
Charging Infrastructure Cost: N/A
OPERATIONS & MAINTENANCE
Capital Costs: New York state purchase incentives reduced the purchase price, resulting in a 12% higher vehicle price after incentives were applied
Operations & Maintenance Costs:
TRAINING & CHANGE MANAGEMENT
Training: Training was conducted for drivers
Change Management: Deployment and training were relatively simple with no challenges
Summary
Lessons Learned:Next Steps:
References
Case Study SourceBusiness for Social Responsibility (BSR). Anderson-DuBose: EV Case Study. https://www.bsr.org/en/collaboration/groups/future-of-fuels/case-studies/anderson-dubose-ev-case-study
Image source:
Orange EV. https://orangeev.com/anderson-dubose-company-deploys-first-orange-ev-electric-yard-truck-mcdonalds-distribution-network/
Winter Park, Florida Municipal Fleet Electrification
The City of Winter Park, Florida discovers cost-effective procurement strategy to begin transitioning EVs into their municipal fleet
- EVs provide more cost savings with increased usage and mileage
- By evolving procurement to include municipal leasing options, EV business cases can become more cost justified, reducing initial upfront capital costs and realizing operational savings immediately
- Speculation existed for EV performance, but exposure to vehicles proved effective at changing initial perceptions
- Activity conducted since 2017
Case Study Information
Overview
Company: City of Winter Park, FloridaType: Municipal fleet
Location: Winter Park, Florida
Case Study Publishing Date: 2020
Program Goals: Begin integrating EVs into the City’s fleet as part of the Winter Park’s first sustainability action plan
Replacement Vehicle Class: Class 1 passenger vehicle; Toyota Highlander Hybrids at the end of their service life
Vehicle Use Case: Short-distance travel by city employees
Replacement Vehicle Fuel Consumption: N/A
Case Study
Objective:In 2017, the City of Winter Park purchased its first EV, a 2017 Ford Focus with a 115 mile range. Within the first year, employees from permitting department and traffic enforcement department began expressing interest in procuring additional EVs based on their positive experience with the City’s first EV.VEHICLE OVERVIEW
Number of Vehicles: 5
Types of EVs: 2017 Ford Focus
EV Deployment Timeline: In 2017 the City purchases its first EV
CHARGING OVERVIEW
Charging Infrastructure: The City relies on public charging within Winter Park
Charging Infrastructure Costs: N/A
OPERATIONS & MAINTENANCE
Capital Costs: $23,682.88 per vehicle, less federal incentives and credits
Operations & Maintenance: N/A
TRAINING & CHANGE MANAGEMENT
Training: Training was conducted for drivers
Change Management: Initial impressions were mixed with speculation on economic benefits of EVs
Summary
Lessons Learned:Next Steps:
References
Case Study SourceThe Climate Mayors Electric Vehicle Purchasing Collaborative (the Collaborative). Municipal Fleet Electrification: A Case Study of Winter Park, FL. https://driveevfleets.org/wp-content/uploads/2018/08/Winter-Park-Case-Study_FINAL.pdf
About the Climate Mayors Electric Vehicle Purchasing Collaborative
The Climate Mayors Electric Vehicle Purchasing Collaborative (the Collaborative) is a joint effort by Climate Mayors, the Electrification Coalition, and Sourcewell working toward accelerating the transition of city fleets to electric vehicles (EVs). By creating a new and innovative cooperative purchasing mechanism, the Collaborative is reducing major barriers to fleet electrification for cities and other public agencies. In addition to an innovative cooperative purchasing option, the Collaborative offers a host of technical resources, analyses, and staff support, which reduces major obstacles to fleet electrification.
About Climate Mayors
Representing over 74 million Americans from 48 states, Climate Mayors is a diverse network of 466 U.S. city mayors who have committed to fighting climate change. Originally founded in 2014, the network’s ranks swelled to almost 400 mayors in response to the Trump administration’s withdrawal from the Paris Agreement. Climate Mayors commit to taking ambitious action to meet each of their cities’ current climate goals, while working together towards achieving our national Paris targets. Climate Mayors is founded and Chaired by Los Angeles Mayor Eric Garcetti, and Co-Chaired by Mayors Sylvester Turner (Houston) and Martin J. Walsh (Boston).
About the Electrification Coalition
The Electrification Coalition (EC) is a non-partisan, not-for-profit group committed to promoting policies and actions that facilitate the deployment of plug-in electric vehicles on a mass scale in order to combat the economic, public health, and national security dangers caused by America’s dependence on oil. The EC works with a variety of stakeholders that represent the entire electrified transportation value chain, positioning the organization as a dedicated rallying point for an array of electrification allies.
About Sourcewell
Sourcewell is a self-supporting government organization, partnering with education and government agencies throughout North America. They offer a cooperative purchasing program with over 300 awarded vendors on contract. On behalf of their 50,000 members, Sourcewell conducts competitive solicitations, awarding to the most responsive and responsible vendors. The result of this cooperative effort is a high-quality selection of nationally leveraged, competitively solicited contract solutions to help create efficiencies and meet the ever-challenging needs of current and future member agencies.
Image source:
Isaac Babcock. Winter Park / Maitland Observer. Electric cars charge for free in Winter Park.
https://www.orangeobserver.com/article/electric-cars-charge-free-winter-park
Vermont Municipal Case Studies

Evaluating cost-effectiveness of municipal fleet electrification utilizing municipal leasing programs
- EVs represent an opportunity for municipalities to advance energy and climate goals
- EVs improve the quality of life for residents due to reduced noise and no tailpipe emissions
- The business case for electrification benefits from higher mileage and vehicle utilization
- EV applications need to be tailored to vehicle model and range for optimal utilization
- EVs are less expensive than internal combustion engine vehicles
- Fleets will benefit from expanded models of EVs to right-size applications with vehicles as the market matures
- Activity conducted from October 2013 through October 2016
Case Study Information
Overview
Company: Vermont Municipal Case Studies including the municipalities of Jericho, Milton, Winooski, and the Chittenden County Regional Planning CommissionType: Municipal fleet
Location: Vermont
Case Study Publishing Date: June 2016
Fleet Size: N/A
Program Goals: Leverage special leasing program to begin implementing EVs into municipal fleets to achieve goals established in the State of Vermont’s Comprehensive Energy Plan (CEP)
Fleet Conversion Vehicles: Various diesel, gas, and personal travel / mileage reimbursement
Replacement Vehicle Class Light-duty passenger class
Vehicle Use Case: Various; primarily short-distance travel
Replacement Vehicle Fuel Consumption: N/A
Case Study
Objective: In 2013, Vermont municipalities were presented with an opportunity to lease Mitsubishi i-MiEVs through a special leasing program offering the vehicles at $110 a month for three years with no down payment.VEHICLE OVERVIEW
Number of Vehicles: 7 total
Types of EVs: Mitsubishi i-MiEVs
EV Deployment Timeline: October 2013 - October 2016
Miles Driven:
CHARGING OVERVIEW:
Charging Infrastructure: Level 2 public charging
Charging Infrastructure Cost: Various
OPERATIONS & MAINTENANCE
Capital Costs: Municipal leasing program for $110 a month for three years with no down payment
Operations & Maintenance Costs: N/A
TRAINING & CHANGE MANAGEMENT
Training: No special training was required for drivers
Change Management: Deployment and training were relatively simple with no challenges
Summary
Program Results:Chittenden County Regional Planning Commission:
Town of Milton:
City of Winooski:
Lessons Learned:
Chittenden County Regional Planning Commission:
Town of Milton:
City of Winooski:
Next Steps:
Chittenden County Regional Planning Commission:
Town of Milton:
City of Winooski:
References
Case Study SourceVermont Energy Investment Corporation. Electric Vehicle Fleet Case Studies 2016. https://www.ccrpcvt.org/wp-content/uploads/2018/12/V2-FINAL-CCRPC_EV_Fleet_CaseStudies_CCRPC.pdf
Image source:
Photo credit: Gina Campoli. https://accd.vermont.gov/sites/accdnew/files/documents/CD/CPR/2019_EVSE_Program_Description_and_Application_Round_2_FINAL_190320.pdf
Chula Vista, California Municipal Fleet Electrification

Achieving plans to transition 40% of the City's fleet to alternative fuel vehicles (AFV) by 2020
- The City has transitioned 36% of its fleet to AFVs
- EVs saved 75% on fuel costs and were in operation 84% more of the time
- EVs were 80% more cost effective in comparison to maintenance and repairs
- Fuels costs are 61% lower than internal combustion replacement vehicles
- Replacing older models in the City's fleet allowed for immediate cost savings to be realized
- Utility incentives reduced charging infrastructure costs
- The City's mantra “Fleet follows facilities” prioritizes charging infrastructure first to align procurement and account for longer installation lead times
- Activity conducted since 2012
Case Study Information
Overview
Company: City of Chula VistaType: Municipal fleet, charging infrastructure
Location: Chula Vista, California
Case Study Publishing Date: June 2019
Fleet Size: N/A
Program Goals: Municipal fleet electrification aligned with the City's sustainability goals
Replacement Vehicle Class: Light-duty vehicles
Vehicle Use Case: Short-distance travel by the City employees in the Senior Vehicle Patrol (SVP), building code enforcement, and city pool
Replacement Vehicle Fuel Consumption: N/A
Case Study
Objective: In 2000 the City of Chula Vista became the first city in San Diego County to adopt a Climate Action Plan (CAP); updates were made to the CAP in 2017 to replace all new vehicles with AFVs wherever possible and in 2018 the City Council voted to acquire 34 new fleet vehicles, including 14 battery-electric vehicles and 28 plug-in hybrid models. The City transitioned vehicles based on age, mileage and expense to maintain.VEHICLE OVERVIEW
Number of Vehicles: 41
Types of EVs: Various; procurement via the Climate Mayors Electric Vehicle Purchasing Collaborative
EV Deployment Timeline: Beginning in 2018
CHARGING OVERVIEW
Charging Infrastructure: 123 Level 2 charging stations
Charging Infrastructure Costs: $456 was the average cost for L2 installation and equipment; 30-35 stations were installed free of charge due to utility incentives in disadvantaged communities through a pilot project
OPERATIONS & MAINTENANCE
Capital Costs: $28,000 per vehicles procured through a municipal lease program
Operations & Maintenance: EV maintenance & repair costs of $.03, compared to $.15 with older vehicles
TRAINING & CHANGE MANAGEMENT
Training: Individual trainings are conducted as departments are assigned EVs; larger fleet pools would require more broad-based training and outreach
Change Management: N/A
Summary
Program Results:Lessons Learned:
Next Steps:
References
Case Study SourceThe Climate Mayors Electric Vehicle Purchasing Collaborative (the Collaborative). Municipal Fleet Electrification: A case Study of Chula Vista, CA June 2019. https://driveevfleets.org/wp-content/uploads/2019/06/Chula-Vista-Case-Study.pdf
About the Climate Mayors Electric Vehicle Purchasing Collaborative
The Climate Mayors Electric Vehicle Purchasing Collaborative (the Collaborative) is a joint effort by Climate Mayors, the Electrification Coalition, and Sourcewell working toward accelerating the transition of city fleets to electric vehicles (EVs). By creating a new and innovative cooperative purchasing mechanism, the Collaborative is reducing major barriers to fleet electrification for cities and other public agencies. In addition to an innovative cooperative purchasing option, the Collaborative offers a host of technical resources, analyses, and staff support, which reduces major obstacles to fleet electrification.
About Climate Mayors
Representing over 74 million Americans from 48 states, Climate Mayors is a diverse network of 466 U.S. city mayors who have committed to fighting climate change. Originally founded in 2014, the network’s ranks swelled to almost 400 mayors in response to the Trump administration’s withdrawal from the Paris Agreement. Climate Mayors commit to taking ambitious action to meet each of their cities’ current climate goals, while working together towards achieving our national Paris targets. Climate Mayors is founded and Chaired by Los Angeles Mayor Eric Garcetti, and Co-Chaired by Mayors Sylvester Turner (Houston) and Martin J. Walsh (Boston).
About the Electrification Coalition
The Electrification Coalition (EC) is a non-partisan, not-for-profit group committed to promoting policies and actions that facilitate the deployment of plug-in electric vehicles on a mass scale in order to combat the economic, public health, and national security dangers caused by America’s dependence on oil. The EC works with a variety of stakeholders that represent the entire electrified transportation value chain, positioning the organization as a dedicated rallying point for an array of electrification allies.
Image Source
San Diego Gas & Electric. http://www.sdgenews.com/article/transitioning-electric-vehicles-helps-city-chula-vista-save-money